

Francis Berner
Monday, 10 October 2022 14:27
THE ROLE OF OIL ANALYSIS IN WIND TURBINE RELIABILITY

Traditionally, South Africa has relied on non-renewable coal resources for the production of electricity. In fact, more than 80% of the country’s power is generated from this fossil fuel. However, as the demand for electricity has surged – and at times, outstripped supply – it’s become critical to consider more viable energy resources. One such resource is wind – an abundant, renewable energy resource that has been used to generate power for thousands of years. Wind is a clean, free and infinite resource that presents viable opportunities for energy production in South Africa.
South Africa’s Integrated Resource Plan (IRP), under the leadership of the Department of Energy (DoE), foresees renewable energy contributing to 42% or 17.8GW of the country’s new generation capacity by 2030. One of the ways they plan to achieve this is with 8.4GW of wind generated power.
While wind energy in South Africa is still, relatively speaking, in its infancy, when compared to more developed nations, the benefits of developing this alternate energy resource have become abundantly clear. Over time, wind energy could help to alleviate the country’s dependence on expensive, harmful and diminishing fossil fuels, while providing a sustainable and secure energy resource for a greater number of people. The message is clear, the transition to clean renewable energy is about making an investment in the future of our civilization and the planet.
According to a new analysis published by the Global Wind Energy Council (GWEC), South Africa added 515 MW of new wind capacity in 2020 cementing its wind leadership on the African continent.
By the end of last year, South Africa had 2 500 MW of cumulative wind capacity installed, representing about 34% of the 7 300 MW of capacity installed across Africa and the Middle East.
However, these two regions represent only a fraction of the total market, with global additions of about 70 GW in 2020 and with the cumulative installed base expected to grow to about 800 GW in 2021.
The DoE’s Renewable Energy Independent Power Producer Procurement Programme (REIPPP) has already overseen the completion of four successful bidding windows with a fifth window launched in March of 2021.
The approved wind farm bids from all four bidding rounds has resulted in the construction of several wind farms over the last few years that collectively house more than 1200 wind turbines with many more installations on the horizon.
The much anticipated fifth round of this procurement program (REIPPP) has been issued with the Ministry of Mineral Resources and Energy (MMRE) which seeks to procure a further 1.6 GW of wind energy.
It is self-evident from the above that in the current environment of renewable energies, wind energy has played an important role as a driver of change in the generation of clean alternative energy. However, this rapid increase has also given rise to several operational and performance issues related mainly to equipment design and maintenance practices.
As the growth in wind energy has continued, the average size and capacity of wind turbine generators has also increased. With this increase in size comes an increase in the cost of operation, and specifically the cost of repairs, downtime, and unscheduled maintenance.
Added to this the estimated life span of wind turbines is about 20 years, compared to conventional steam turbine generator units that have averaged 40 years. The failure rate of wind turbines is about 3 times higher than that of conventional generators. Therefore, reliability is essential to the success of wind energy systems and this requires appropriate condition monitoring.
As a result of external variants, wind turbines undergo constantly changing loads, unlike conventional power plants. Due to these highly mutable operational conditions the mechanical stress placed on wind turbines is unmatched in any other form of power generation and they consequently require a high degree of maintenance to provide cost effective and reliable power output throughout their expected 20-year life cycle.
Ensuring long-term asset reliability and achieving low operation and maintenance costs are therefore key drivers to the economic and technical viability of wind turbines becoming a primary renewable energy source in South Africa.
The adequate functioning of most utility-scale conventional wind turbines depends to a large extent on the performance of the gearbox. These gearboxes transform slow speed, high torque wind turbine rotor rotations to the higher speed required by the generator, which converts the mechanical power to electricity. They are typically configured to have planetary gearsets and bearings that require special attention due to their extreme operating conditions and high lifetime expectations.
The wind turbine gearbox is the most critical component in terms of high failure rates and down time. These premature gearbox failures are a leading maintenance cost driver that can substantially lower the profit margin of a wind turbine operation as they typically result in component replacement.
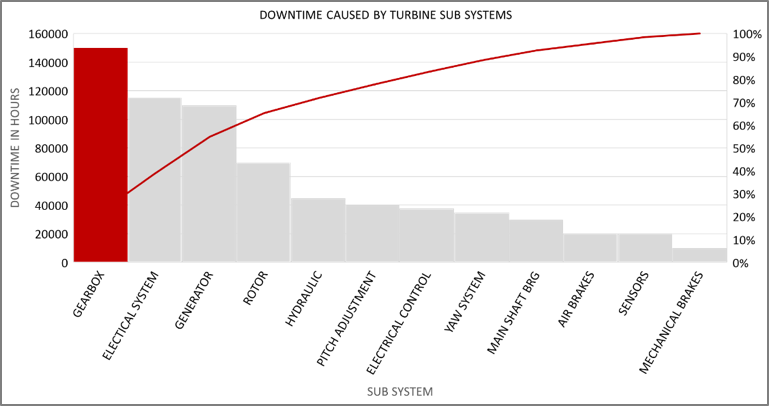
According to a study published by the National Renewable Energy Laboratory (NREL) the mean downtime for gearbox failure was in the range of 6-15 days for a study performed on European on-shore wind turbines over a 13-year time period. The mean downtime could be even longer if a spare gearbox is not available and crane availability is an issue. The same study also looked at data representing about 27,000 turbines ranging from 500kW to 5 MW over a six-year period and found that the cumulative downtime caused by gearbox failures was more than one hundred and fifty thousand hours.
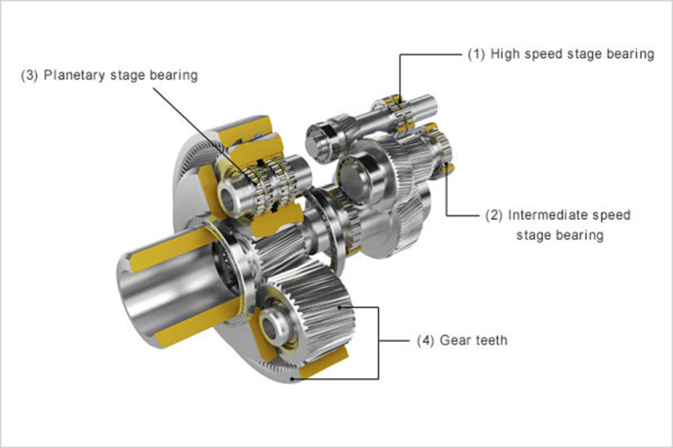
Further analysis found that 76% of gearbox failures were bearing related and mostly due to High Speed Shaft (HSS) & Intermediate Speed (IMS) bearing axial cracks.
Despite significant advancements in gearbox design, they remain an operation and maintenance cost driver due to the very high associated repair costs coupled with a high likelihood of failure through much of the wind turbine’s life cycle.
Therefore, reliability is essential to the success of wind energy systems and this requires appropriate condition monitoring of sub-systems like the gearbox. Its is for this reason that condition monitoring techniques like oil analysis are considered far more effective predictive/proactive tools for achieving optimum gearbox performance as, in the case of oil analysis, the technique can be used to detect the onset of early damage as well as tracking the severity of the damage.
Routine oil analysis is one of the most widely used predictive / proactive maintenance strategies for wind turbines and utilises a test slate that evaluates the condition of the in-service lubricant and helps evaluate the condition of internal mechanical components. In short, Routine oil analysis is used as a frontline defence against premature gearbox failures.
The three main objectives of oil analysis are to monitor the health of the gearbox, monitor the health of the oil and monitor contaminants. Active monitoring of the above provides early warning of abnormal operating conditions that can lead to catastrophic failures if not corrected.
These three objectives can be expanded to six main functions of an oil analysis programme which are to: detect abnormal wear, detect oil degradation, detect contamination, optimise service intervals, avoid loss of production and ultimately, to save money.
The test slate offered by WearCheck as part of their wind turbine oil analysis programme is designed to achieve these six main functions.
To illustrate the potential savings that could be relalised with a proactive maintenance strategy like oil analysis the below cost benefit analysis was performed.
The cost involved in installing a commercial-scale wind turbine can vary significantly depending on the manufacturer of the turbine, the number of turbines, finance and legal costs, construction contracts, the location of the project, infrastructure requirements as well as numerous other factors outside the scope of this document. For the purpose of this analysis the assumption has been made that a utility scale wind turbine costs about ZAR 17 million per MW of capacity.
With replacement of the main gearbox being approximately 10% of the overall wind turbine cost, replacing a 3MW wind turbine gearbox could easily exceed ZAR 5.1 million with transportation, crane rental etc. Over the 20-year expected life span of the wind turbine the main gearbox is expected to be replaced 2.2 times due to failure.
If the gearbox life could be extended by even one year, the replacement costs associated with the wind turbine life cycle will be reduced by ZAR 561,000 per turbine.
Applying this savings to wind farm with 50 – 3 MW turbines equates to a savings of more than ZAR 28 million over the life cycle of the wind farm. The saving does not take into consideration the down time costs associated with loss of electricity production which in itself would be validation for a proactive maintenance programme of this nature.
Oil analysis provides a solid foundation on which to build an effective condition monitoring programme in many applications. In the case of wind turbine gearboxes, oil analysis has the potential to reduce unscheduled maintenance, improve reliability and extend service life. The oil analysis tests performed by WearCheck can help wind farm operators get maximum value from their oil sampling program. When these tests are performed on a routine basis and the results analysed by our experienced technicians, oil analysis can facilitate the maintenance of wind turbine gearboxes and ultimately, support this promising form of power generation on the African continent and beyond. Let WearCheck help you protect the assets that protect our planet.
By Steven Lumley
Published in
Blog
Tagged under
Thursday, 25 August 2022 11:08
Dispersant additives, water contamination solutions, mega May milestones and more…

Our latest issue of the Monitor newsletter has hit the streets! In it, you can learn all about the amazing scientific properties of dispersant additives, what happens when a gearbox sump is overfilled, how to minimise hormone contamination in water, our marvellous May achievements, where to enter our 2022 customer survey, and all sorts of other interesting snippets.
Published in
Blog
Tagged under
Wednesday, 10 August 2022 17:31
THE IMPORTANCE OF WATER QUALITY MONITORING

By Moses Lelaka, Technical Water Lab Manager
When we turn on the tap and run a hot bath, fill up the glass of water for drinking, go for a swim in the deep blue oceans or fry up a freshly caught fish from the lakes, rivers and dams or even streams, most of us take it for granted that these are all safe actions. The truth of the matter is that the scientists, water boards, engineers, local authorities and water quality specialists are working tirelessly behind the scenes to ensure that the quality of this precious commodity is as high as possible.
Living organisms need water to survive. All oxygen-dependent organisms need water to aid in the respiratory process. Some organisms such as fish can only breathe in water. Other organisms require water to break down food molecules or generate energy during the respiratory process.
Water quality is a very critical practice carried out in countries around the globe. The South African Department of Water and Sanitation has committed to effectively implement the blue drop and green drop certification programmes which call for excellent drinking water and wastewater quality management in the country. The World Health Organisation (WHO) has continually produced guidance on the management of drinking water quality since 1958 when it published the international standard for drinking water.

What is water quality?
Water quality can be defined as the measure of suitability of water for a particular use, based on these characteristics:
Physical characteristics - temperature, colour, sediments suspended in water
Chemical characteristics - dissolved oxygen, acidity nutrients, dissolved salts, pH etc
Biological characteristics - bacteria, algae and waterborne plants
Human activities cause changes in these attributes and thus affect living resources over time. Sewage, industrial chemicals, heavy metals from industrial processes, and household cleaners are just a few examples of materials that are commonly discharged into rivers and streams.
Additional water pollutants include chemicals, pesticides, fertilizers, motor oils, litter and other components of polluted runoff.
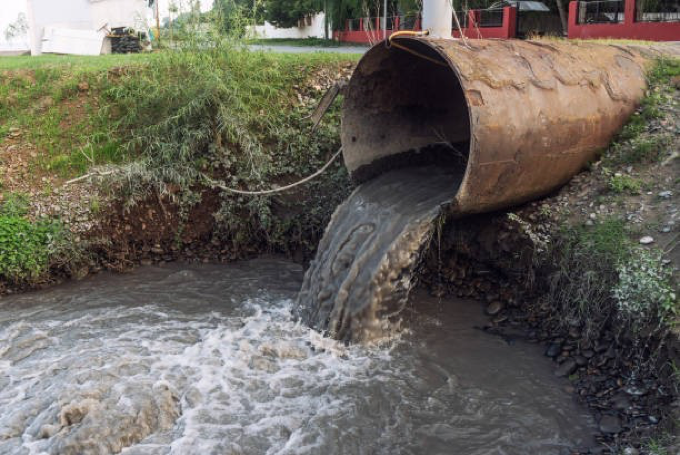
The other way that human activities impact on the water quality is by changing ecological process that naturally purify water. Healthy aquatic ecosystems such as wetlands, streams, bays, and oceans have natural processes that purify water of wastes. Micro-organisms decompose organic waste into nutrients that can be absorbed by plants.
Wetlands act as natural filtering systems as they trap sediments, hence preventing the sediments from reaching the streams.
The most common direct impact on wetlands includes removal of vegetation and building/construction. All these activities can result in increased flooding, extinction of certain species as well as the decline in water quality.
Why monitor the water quality?
Monitoring provides the evidence necessary to make decisions on managing water quality today and in the future. This alerts us of the current, ongoing and emerging problems to determine compliance with drinking water standards and to protect other beneficial uses of water such as irrigation.
Water quality monitoring also assists the law-makers and water managers to formulate new policies to better protect human health and the environment.
WearCheck’s experienced team of water analysts tests a wide range of water samples every day to determine the water condition and whether it is safe for human consumption, swimming, irrigation, industrial use and whether it complies with the strict disposal requirements.
The WearCheck family has grown with the recent acquisition of Set Point Water Laboratories. Incorporating these specialised water analysis skills into our business, means we can offer our clients diverse testing and analysis options. Visit our website for more info.
Published in
Blog
Tagged under
Tuesday, 12 July 2022 14:30
Case Study: filter fitting delivers cost savings

Overview
Steelpoort - a chrome-mining WearCheck customer recently embarked on a reliability improvement programme which focused on the handling and management of commodities used in their production equipment (LHDs – load, haul, dump machines), namely fuel, lube, air and coolant. An audit was completed and recommendations for improvements were broken down into quick fixes, as well as medium- and long-term goals.
When mining the customer oil analysis data, we identified soot levels to be exceptionally high on both the Cummins and John Deere engines used in these LHDs. These machines operate 80 hours a week and are serviced at around the 160 hour mark. Attempting to push past this point would negatively affect the life cycle of the engine. High levels of wear, increased viscosities, and a significant spike in soot from time to time meant that these engines had to have their service intervals reduced from the OEM’s recommendation of 250 hours. The decision to comprehensively service these machines every two weeks, coupled with engine failures, became a big cost pressure for the mine.
The problem
Soot is a by-product of combustion. Increased levels of soot could indicate many things but, in this case, we found that after the 160 hour mark, these air filters were heavily loaded with process contamination. The poor air/ fuel mixture no doubt caused the high soot levels and an attempt to bring soot levels down was initiated.
The graph below represents the soot values between services:
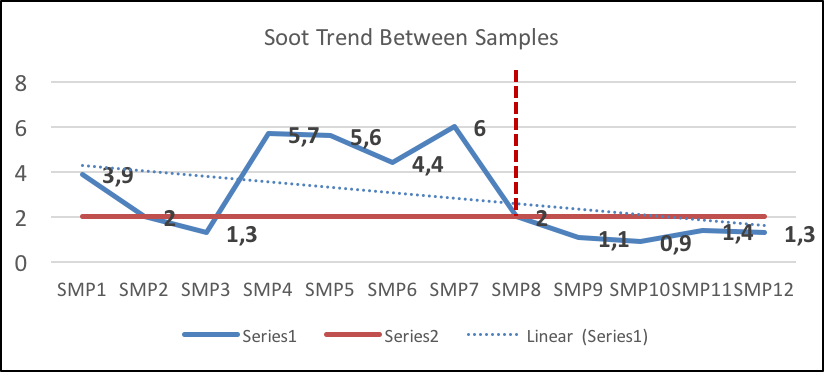
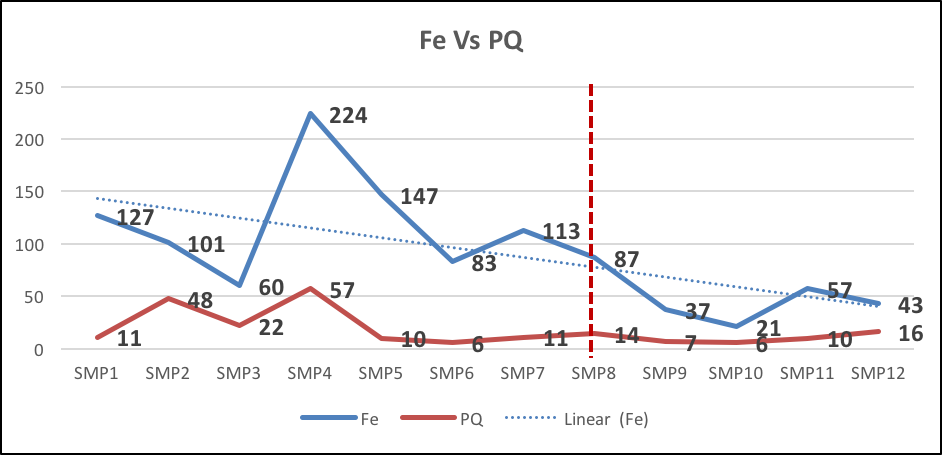
The checkered red line indicates point of installation
The solution
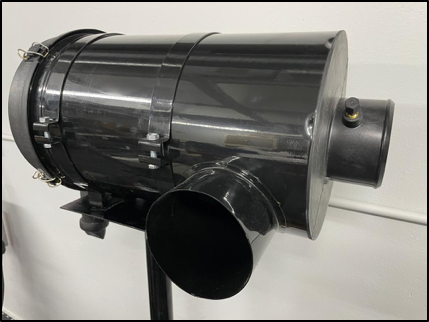
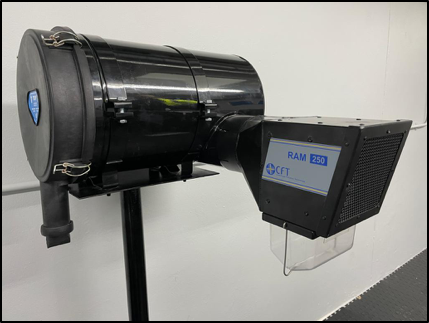
The filter used by the OEM on this LHD was a Donaldson PowerCore. This filter has a conventional primary and safety filter set-up with a built-in pre-cleaner. Given that the oil reports were screaming at the air filter, we substituted the PowerCore filter with another Donaldson filter as we found their FRG series housing (FRG11-0241) would be the right choice for this application. We added to this filter our NEZROTEK air pre-cleaner.
 |
 |
|
The Standard FRG11 – Filter Housing |
The Standard FRG11 with NEZROTEK Pre filter connected |
The results
The results from this trial were instant. After the first sample we could see an improvement in the levels of soot which got progressively better over time. This is what is referred to as an “optimised state”. Loosely translated, this means that the engine is basically happier than before.
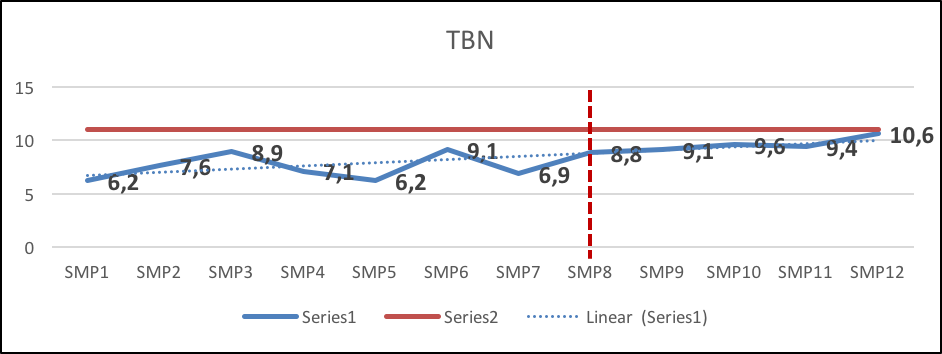
One of the more notable trends was that of the Total Base Number (TBN). Less harmful by-products of combustion meant that the oil did not have to work as hard, thereby increasing the TBN to healthier levels.
On a side note, the pre-cleaner removed an average of 139 grams of process contamination over a six week period.
Conclusion
We have, since these results, marginally increased the size of the pre-cleaner to allow for more air flow and lower clean deferential pressure, which should allow for even longer filter life. This, in conjunction with lower overall wear and improved oil health, allows us to look at extending the drain interval. This will be a consideration however, for now, the focus is on getting maximum life out of our capital-intensive components.
Published in
Blog
Tagged under
Tuesday, 05 July 2022 11:29
DOCTORED DIESEL IS DANGEROUS

In response to an article that appeared in Fin 24 on June 15th of this year, Gwede Mantashe, the Minister of Mineral resources and Energy warned of the use of illuminating paraffin (IP) to doctor diesel in an attempt to defraud the revenue services and increase profits. The following article by WearCheck diagnostics manager, John Evans, gives a bit of background to this practice, the deleterious affects it can have and the various methods for testing diesel for the presence of illuminating paraffin.
Diesel can be subjected to a variety of chemical and physical tests in the fuels laboratory. One of the most common and important things to look for is contaminants, the most common of which are dirt and water.
Diesel can also be contaminated with other fuels and solvents, in particular illuminating paraffin or IP as it is known. IP is a readily available power source for domestic lighting, heating and cooking. Chemically it is very similar to diesel but because it is used as a domestic power source, it is not subject to the taxes and levies that diesel is, in other words, it is cheaper than diesel.
The less-than-honest members of our society have taken to doping diesel with IP, and because it is so similar (but not exactly the same) to diesel, a diesel engine will run quite happily on a diesel/IP mixture at less than the cost of diesel. Although the engine will run without problem in the short term, in the long term the IP will be quite damaging to the engine.
IP has a lower viscosity and less lubricity than diesel and will cause damage in terms of increased wear to the components of the fuel system.
Although the price difference may not be huge (about R25 for diesel and about R20 for paraffin) if you think of the thousands of litres of diesel used every day, doping diesel with ten or twenty percent paraffin represents a large cost saving for nefarious operators and significant loss of income for the revenue services (SARS).
The effects of IP contamination on diesel are that the viscosity, density and flashpoint will decrease, and the sulphur concentration will increase. IP also has a lower lubricity than diesel. Low viscosity and lubricity mean increased wear of fuel system components. Low density means you get less bang for your buck (more litres of fuel required for the same number of kilometres travelled). Low flashpoint could become a safety issue and elevated sulphur could impact the emission controls of modern engines and increase combustion by-products being introduced into the lubricating oil and reducing its ability to lubricate the engine adequately.
Interestingly enough, small amounts of IP may not affect the properties of diesel enough for it to fail the Bureau of Standards specification SANS 342 so, IP can be present, yet the fuel will still pass the specifications of SANS 342. In fact, IP is often legally added to diesel in small amounts by the refineries as it helps prevent the diesel from waxing (freezing) during the cold winter months in-land. Doping diesel with IP, in the long term, is not a good idea and it is also illegal.
Because this type of doping represents a loss of income for SARS, they have introduced a chemical marker into illuminating paraffin sold in South Africa. The marker comes from a company in the United States called Authentix, a company that specialises in brand protection and anti-counterfeiting. This marker is added to IP at a precise concentration once the product leaves the refinery.
It is possible to test for this marker - the test kit is a lateral flow test kit, similar to those used for testing for Covid or even pregnancy. The answer is just a simple yes or no, the marker either was or was not detected. The test kit is very easy to use and takes hardly any time at all. What it cannot tell you is how much IP is present. What is important to mention, is that if the IP came from a source that was not marked, for example, from across our borders, where markers are not used, then no marker will be detected, yet the sample could still be contaminated, but not by enough to fail the other physical tests that are carried out, for example, viscosity, density and flashpoint.
Further testing is possible, however. The diesel sample can be sent to a SARS-approved laboratory, where they use an instrument called a GC-MS (gas chromatography – mass spectroscopy) that can measure the actual amount of the marker that is in the fuel and, from that, it is possible to calculate the actual amount of IP in the fuel.
The reason for having two levels of testing is because (at the time of publishing), the lateral flow test kits cost about R500, whilst the actual percentage test costs around R5500 (more than ten times the lateral flow test) and has to be outsourced.
Although it is possible for gas chromatography to be carried out on the suspect diesel sample to look for IP itself, because of the very similar physical and chemical characteristics of the two liquids and the large number of compounds in each, the process is slow, expensive and not particularly accurate.
Whilst on the topic of contaminants in diesel, it is important to take a quick look at the other contaminants that can be found in diesel and have a deleterious effect on the fuel’s performance.
The two most common contaminants are dirt and water. Contamination from these two sources is usually a matter of poor hygiene practice, and enters the diesel through the supply train. Diesel leaving the refinery will be clean and dry, but transport, storage, dispensing and use all introduce sources of contamination.
Dirty diesel can cause increased abrasive wear of injectors and fuel pumps, whilst water can cause corrosion of fuel system components. There are plenty of companies that can remediate or clean up contaminated diesel and it would be hoped that the engine’s on-board fuel filtration system would go some way to keeping harmful contaminants away from sensitive mechanical components.
The other ‘contaminant’ that needs to be considered is sulphur. Sulphur containing compounds are naturally occurring in diesel but are removed during the refining process as sulphur can poison catalytic converters found on most modern diesel engines. High sulphur can also have an effect on combustion by-products entering the engine oil and reducing its ability to lubricate the engine adequately. The testing for the IP marker is fairly straightforward, easy and cheap to carry out, however, sulphur testing requires sophisticated laboratory instrumentation.
South Africa produces three grades of diesel containing either less than 10 ppm, 50 ppm or 500 ppm of sulphur. Diesel (and other fuels) coming into the country from over-border sources may not be subject to our laws restricting the amount of sulphur present in the diesel and represent a hazard to both the lubrication of the engine and the operation of emission control components.
In the end, keep your diesel clean and dry and do not pollute it with foreign compounds that may cause engine damage and may also be illegal.
Do you think your diesel is dirty or has been doctored? Peace of mind is just a WearCheck laboratory away. Contact us to learn more about our comprehensive fuel testing solutions.
Email This email address is being protected from spambots. You need JavaScript enabled to view it. or call WearCheck’s head office on +27 (31) 700-5460.
Published in
Blog
Tagged under
Thursday, 19 May 2022 07:04
Talking Transformer Testing

Transformers, like any other assets, produce their best output when they are in peak operating condition. To keep a transformer in optimum form, it is essential that regular condition monitoring is conducted. By doing this, potential problems are identified early, meaning less unplanned downtime, less maintenance required and longer periods without any maintenance needed.
What is important, though, is to identify all the parameters that can give a complete view of the transformer’s health, and insight into what remedial actions, if any, must be taken to ensure continued reliability.
Technical Bulletin 78 - the first in a series of transformer monitoring articles – features an in-depth discussion about the range of different condition monitoring techniques available for assessing transformer health.
Technical Bulletin 78 is only available in the digital version. You can download it for free here.
Published in
Blog
Tagged under
Tuesday, 26 April 2022 12:13
Demystifying demulsifier additives and more…

In the latest issue of our Monitor newsletter, we launch our new World of Water column in honour of our new water testing services, we share news about our new labs in Cape Town, Kathu and Mozambique, you can plan which condition monitoring training courses your staff will attend during 2022, and there’s even a story about our very own female angling champion, as well as useful info on demulsifier additives, inhibitors and the ever-popular lube tip.
Published in
Blog
Tagged under
Wednesday, 23 March 2022 10:54
IDLING – COSTLY FUEL, WEAR, AND ENGINE-LIFE THIEF

Excessive idling is one of the most counter-productive facets of running a fleet of vehicles. In this Technical Bulletin, trucking expert Dave Scott discusses the effects of excessive idling and how to avoid it to minimise the negative consequences.
The costs
Let’s grab attention up front by following the money. Too many fleet owners cannot calculate the immediate cost of excessive engine idling – it can be massive when applying the following formula:
- Engine idling fuel consumption in litres/hour = 10% of engine displacement at 650rpm.
- An 8000cc truck diesel engine consumes 0,8 litres per hour idling at 650rpm – switch this up to 1000rpm and idling fuel consumption will double.
- The fleet multiplier effect is horrendous – a 50 vehicle fleet equipped with 8000cc engines can consume 40 litres idling diesel every day and in a 250-day working year this totals 10 thousand litres of lost fuel or R200,000 per annum at R20 per litre for only one hour per day.
And then there are the long-term costs…these are more difficult to quantify, but are there:
- Accelerated engine wear - An engine running at idling speed causes twice the wear on internal parts compared to driving at regular speeds. According to the American Trucking Association, such wear can increase maintenance costs by almost $2,000 per year and shorten the life of the engine. Additional press reports indicate that running a vehicle at idle speed dramatically reduces engine life - 60 minutes of idling is equivalent to between 80 and 120 minutes of driving time.
- More frequent engine oil changes – this to counter the effect of idling on engine oil. Incomplete combustion occurs when idling unnecessarily, resulting in over-fuelling. Combustion gases and fuel can enter the crankcase under these conditions, causing deterioration to the oil additive package, and eventually premature engine damage. An OEM (Original Equipment Manufacturer) benchmark is that where idle time is 20% and more, for service intervals to be reduced from 40,000km down to 30,000km
- The costs of global pollution and environmental damage – one wasted litre of combusted diesel fuel throws 2,64kg CO2 into the atmosphere. This is not confined to diesel fuel – petrol engines run at 2,30kg CO2. Now apply the estimated global internal combustion engine population of 1,4 billion motor vehicles and one hour of wasted fuel is disastrous – witness the daily economic effects of climate change.
- Health Risks to Drivers - While sitting in an idling vehicle there is no air flow to vent the emissions. Drivers are exposed to vehicle pollution more so than when the vehicle is in motion.
The myths
Here are the most common false ideas:
Wrong #1 – It is better to operate an engine in idle than frequently switch off and on.
The key word here is ‘frequent’ – in most cases modern truck engine software allows for a three-minute idle before automatic cut-off. Idling must not be left to driver discretion which could be anything from 10 – 30 minutes. The time limit for idling must be in a written driver SOP (standard operating procedure). Many modern passenger vehicles are equipped with idle auto cut-off.
Wrong #2 – Prior to moving loaded vehicles or those without load, idling is essential to warm up the engine before placing the engine under load.
Engines are equipped with coolant thermostats and lubricant/coolant heat exchangers to rapidly reach their operating temperature that is monitored by strategically placed sensors. Simply drive off without excessive over-revving.
Wrong #3 – Idling is good for an engine as there will not be any load on the engine.
Exactly the opposite occurs. Cylinders are designed to operate hot in a diesel engine and to maintain adequate temperature to completely burn injected fuel. During idling, accompanied by low reciprocating piston speed, the compression inside a cylinder will not be as effective as during high piston speeds. Thus, temperatures generated inside the combustion chamber do not attain the optimum level.
A few harsh facts
- Excessive idling means that piston rings do not expand adequately, causing insufficient sealing between piston ring and liners which leads to leakage of compressed gases.
- There is incomplete burning of injected fuel, leaving unburnt fuel in the combustion chamber, and passing the unburnt fuel to the engine sump through the gap between piston ring and liners.
- When fuel starts passing through the gap between the piston ring and the cylinder walls, the fuel washes the piston rings and cylinder liners and dilutes the lubricating oil. This action gradually develops a glazing/shining surface on the liners, eroding the crosshatch marks provided for lubricating oil retention.
- Glazing not only loses oil retention in liners but also slowly erodes the oil film which leads to accelerated wear of piston rings and loss of compression. This further increases the gap between the liner and the rings, causing severe leakage of compressed gases into the crank case, and leading to excess blow-by.
- Excess blow-by means loss of compression pressure, and loss of power and time to overhaul the engine. Further continuation of running with the same status leads to throwing lube oil through exhaust gases (lube oil passing into the combustion chamber through the increased gap between liner and rings).
- Improper burning or poor compression leads to excess carbon formation in piston rings grooves, piston crown, ring band, cylinder head, valves, injector tips etc.
- Excess carbon formation leads to sticking of piston rings in grooves, leakage of gases between valve and valve seats, improper fuel spray due to blocked injector spray holes and ultimately aggravating all issues mentioned above and loss of power.
- Diesel dilution in an engine causes a drop in lube oil viscosity and washing out bearing surfaces, dropping lube oil pressure, killing oil film, and making metal to metal contact of moving parts. Ultimately, a faster wear of bearings and journals occurs, and premature engine overhaul is necessary.
- Diesel mixing with lube oil also leads to faster wear of lube oil pump components and reducing pump efficiency. Lower oil pressures at idle are only going to add to accelerated wear issues.
- Fuel spiking with uncertified biodiesel mixtures and illuminating paraffin has a distinct impact on diesel lubricity which will only magnify idling problems.
The countermeasures
In the USA, legislation has already been introduced to curtail excessive idling – enforcement is the challenge. It’s very doubtful this will ever come to Africa as we struggle to apply even the basic traffic safety laws.
But don’t rely on Governments and legislation – there are actions that can be taken by large fleets and private motorists.
- Training and mentoring drivers is priority #1 – in any corporate body with a vehicle fleet there is much ignorance around idling and possible solutions to reduce time spent idling. Coaching must be consistent and not just a seasonal fad. Standard operating procedures for engine idling must be part of a training programme and safety culture. Teaching drivers to avoid idling from when they’re first hired will help establish best practices at the outset.
- Routing and scheduling are all about route surveys and timing – the shortest route might entail the most idling. And then there are loading and off-loading logjams where idling is prevalent. Getting jammed in the morning rush-hour destroys productivity t.km (ton.kilometres) and wastes idling fuel.
- Fleet management software employing GPS tracking is a most useful tool to reduce fleet idling. But this does need CAN (controller area network)-based electronic architecture to extract the data. This software can be used to gather real-time data about what vehicles and drivers are doing, so fleet managers can see if there are any ways to improve performance and decrease time spent idling. And then publish this to prove the savings. Recognise and celebrate the improvements.
- Idling in small vehicles is just as critical – set a benchmark. Plan to switch off the car’s engine if you plan to idle for longer than 20 seconds. It is a common myth that restarting an engine uses more gas and causes engine wear.
- Don’t spend time idling to warm up an engine - just start driving. Engines warm more quickly when they are being driven than when idling.
- Fix the brakes! Common problems in SA truck-trailer fleets are leaking air-brake systems. Drivers idle truck-tractor engines to maintain 8-bar brake system pressure and release automatic spring brakes
- Operators can install auxiliary power units (APUs) to reduce engine idle time. APUs can power trucks during rest periods without using fuel so that drivers can enjoy the comforts of their cabins, such as AC and lights, without burning fuel.
Engine idling may seem harmless, but it has tremendous impacts that can negatively affect everyone. It wastes a significant amount of money on fuel and puts harmful toxins into the environment.
The rising price of diesel will make engine idling a top subject in managing fuel consumption (it’s currently over 90 USD/Brent crude barrel). It’s not only winter that keeps both diesel and petrol engines idling but summer as well – many modern trucks have air-conditioning, that drivers like to keep running.
It’s time to monitor and reduce engine idling through MBWA (management by walking around).
Fleet managers must get out there early to see engine start-up procedures and what is happening at consignees during unloading. Changing idling behaviour is the simplest way and this cannot be achieved from behind a desk in a heated office.
On a personal note: keep engine idling top of mind when driving so that you can do your part to reduce it.
At WearCheck, we encourage fleet managers and owners to take good heed of the advice given here, and to implement driver education procedures. It will extend the life of the engine and components, it will reduce fuel consumption and, while boosting your bottom line, it is also kinder to the environment.
Our team of highly experienced diagnosticians regularly processes used oil samples which show damaged to components that is caused by excessive idling.
To discuss how to implement a reduced idling programme, don’t be idle! Please contact one of our diagnosticians on This email address is being protected from spambots. You need JavaScript enabled to view it., call 031 700-5460, or visit www.wearcheck.co.za.
References:
- The Evils of Idling and How to Avoid Them – Barb Goodrich Manager, Engine Fluids – John Deere
- Technical thoughts of Bhaskarudu Peddakotla – Andhra Pradesh India
- The Evils of Idling and How to Avoid Them – Barb Goodrich Manager, Engine Fluids – John Deere
About the writer:
Dave Scott is an award-winning journalist and author, with a career spanning over 50 years in the transport industry. He is a member of the SA Institute of Tribology (SAIT) and editor of their newsletter, taking a keen interest in the application of lubricants to road transport maintenance and the cost of ownership. He also serves as the technical correspondent for FleetWatch magazine and the truck correspondent for AutoForum magazine and has done for many years.
Published in
Blog
Tagged under
Tuesday, 14 December 2021 14:26
Festive Season opening hours, new water division, foam inhibitor tech tip and plenty more!

Monitor 86, just hit the shelves! This newsletter is jampacked with useful info – a discussion on additives (foam inhibitors, this time round), our 2022 training course dates and info, an interesting perspective on coolant as well as a warning about IP (illuminating paraffin) contamination in diesel and the effect this has on engines.
These stories and many more valuable nuggets can be found in Monitor 86 – you can download it here, for free.
Published in
Blog
Tagged under
Monday, 15 November 2021 17:00
A new perspective on modern day maintenance

WearCheck provides thousands of customers each year with world-class condition monitoring (CM) services, which have been proven time and again to save time and money for companies by identifying potential machine failure before it happens.
And yet, despite this incontestable evidence, there are still many maintenance organisations that continue to shun condition monitoring – why?
In this issue of Technical Bulletin, the answer to this question is explored and presented after a fascinating peek into the history of modern day maintenance.
Technical Bulletin 75 is only available in the digital version. You can download it for free here.
Published in
Blog
Tagged under